Improving How Universities Teach
Book Review – Improving How Universities Teach Science (Carl Wieman)
This post is a long one in the making. I should dedicate it to my wife, as this has been a family project running for years. We will divert from science management for this issue, and talk about grocery management! So a post on data science for everyone!
Here is a short prelude to a longer story: back in the covid years, my wife and I were living in Vancouver, and dealing with the steep prices of the city on academic salaries. Given we love cooking, for fun (and maybe out of spite as well), we started hacking the city for grocery bargains. We were very successful and, by the time we were about to leave to Boston (our current residence), I told a friend - whose identity I will spare, to not gloat too much! - that we seemed to be spending about $20 bucks a week in groceries for two people. He called me a liar (or just plain wrong). He underestimated my scientific spirit; he didn’t know what he was starting.
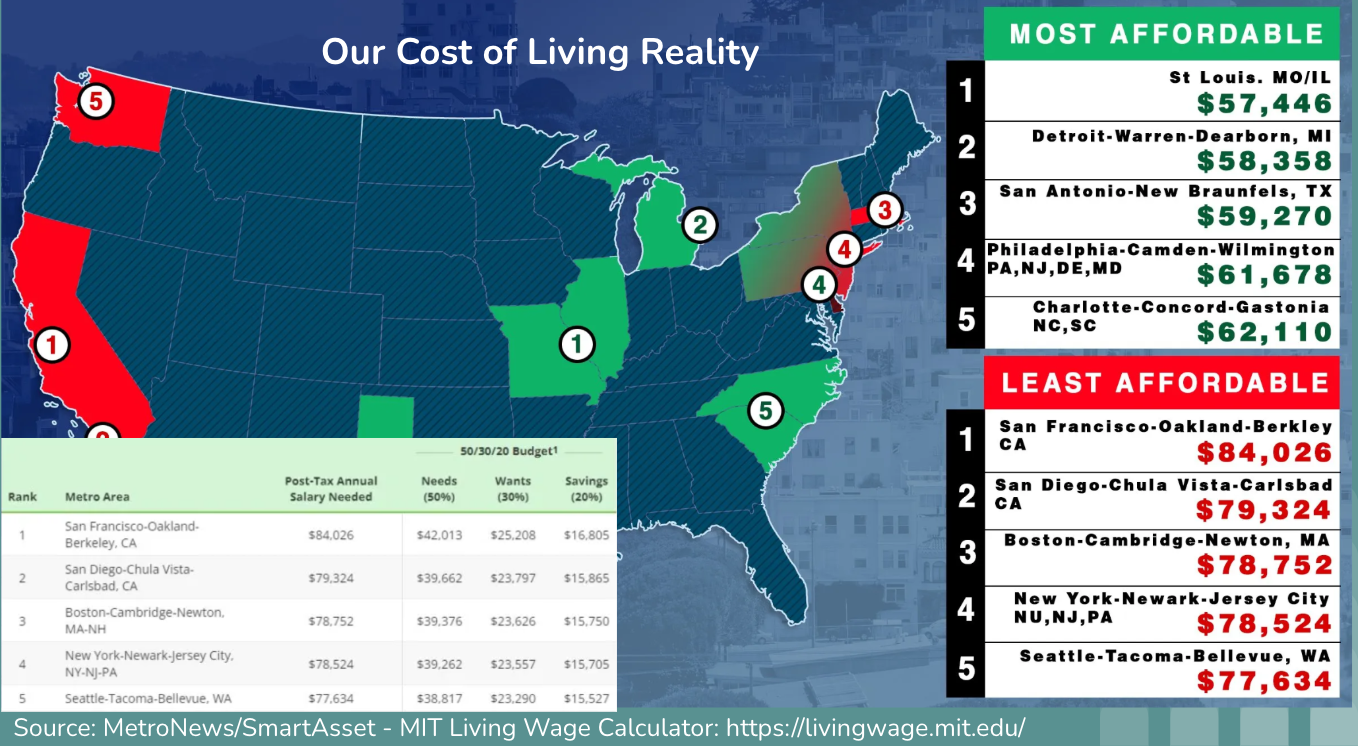
Boston, like Vancouver, is one of the worst cities in the world (and in particular in the US) for cost of living. Here goes an illustrative chart on that:
The motivation to hack Boston groceries was there for me and my wife, just like in Vancouver, and I was determined to get revanche on my friend who doubted me. So we decided to go quantitative. Since our first week in Boston, we started a spreadsheet where we have registered every single grocery purchase we ever made (focused on foodstuffs only). Fast-forward 3.5 years and we have over 1000 entries of data!
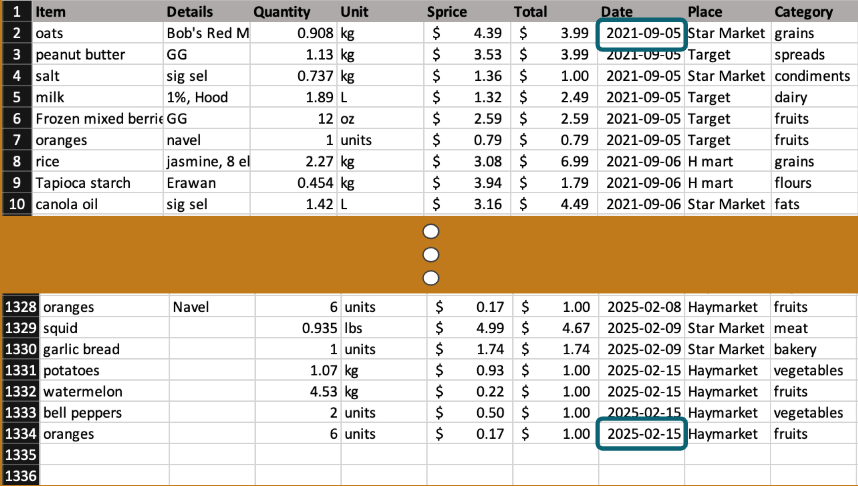
Plenty for our scientific minds to have fun with.
A small disclaimer: Boston scientific culture is cramed with opportunities for free food (both in academia and industry settings). Given that, we are very mindful about cooking most of what we eat, not having more than one free meal per week, on average, and not going to restaurants mode than once a month (not a challenge; Boston’s restaurant’s scene is surprisingly not that exciting). These free meals and restaurant food expenses are not accounted for. What we account is just what is spent in pure grocery shopping, which by far and large accounts for most of our monthly expenses other than bills/rent.
The database accounts for names of the items, quantity purchased, price and price per quantity (“specific price” or “Sprice”), date, place, and category. We also included a details column for any noteworthy comments we felt like making. Keeping format and units through quantities is not always easy, and every now and then we have to review the database for drifts in patterns. That introduces a degree of uncertainty in the data which, since our dataset is so large and mostly coherently populated, is likely to be inconsequent to the truthfulness of broad conclusions on our patterns.
So let’s look at interesting general insights that we believe can be quite meaningful to the typical Bostonian. And also some personal insights we learned about our on consumer patterns.
Let’s start with some exemplary photographs of what a grocery day can look like.
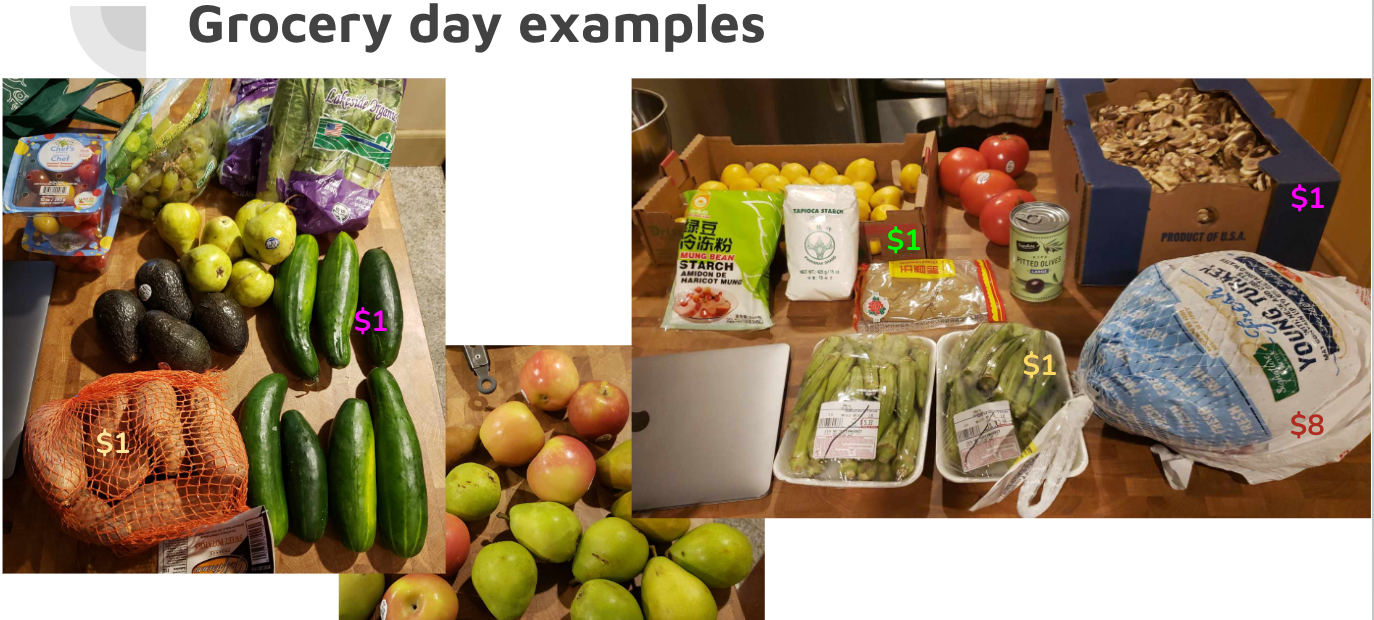
As can be seen, good deals can include vegetables and fruits, as much as meats and packaged ingredients. The secret here is that this city (as perhaps many in the USA) deal with too much abundance, and the surplus market can lead to unbelievable deals (like 30+ lemons for $1).
Our data allows us to carefully consider where do we go most for purchases and draw some geographic correlations. We live in the North End neighborhood, which is fairly central and well connected. 4-5 different stores concentrate the majority of our expenses. We found out that we are lazy, but not that much. We certainly visit markets and stores closer to us more often than far, but we actually put the effort to reach some farther destinations because their deals are special to us. Quantitatively (data not shown), we do groceries within a couple km from our home about 85% of the time, but out of the remaining 15%, almost its totality brings us to about full 5km away from where we live (and we got no cars).
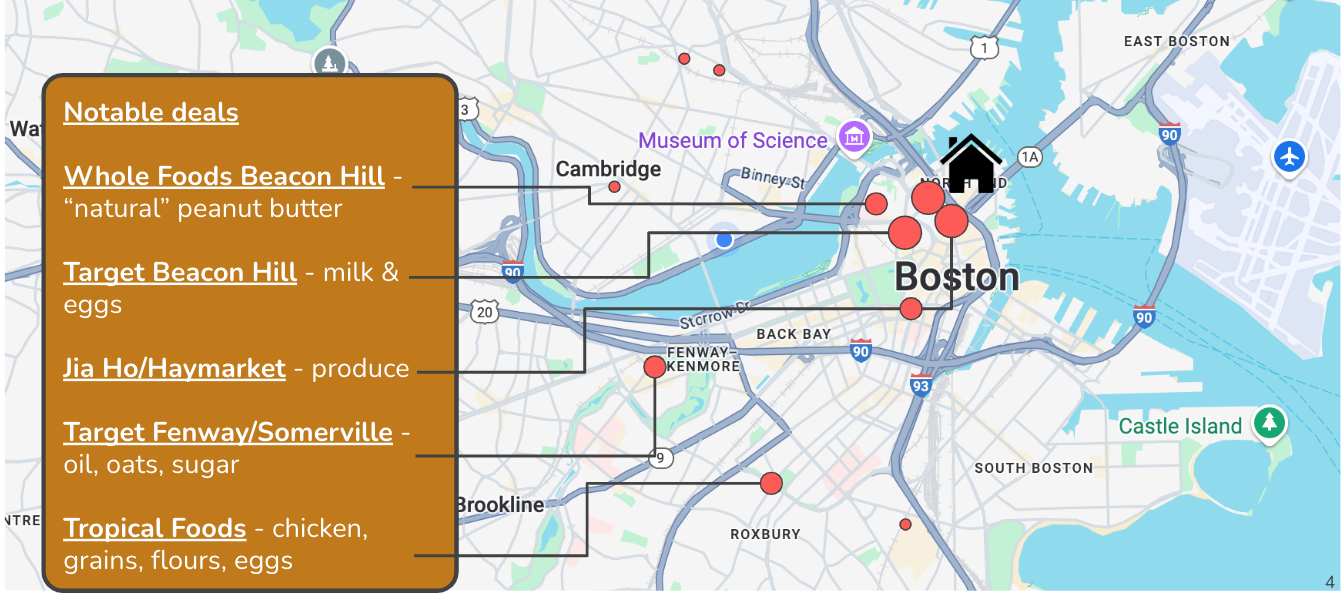
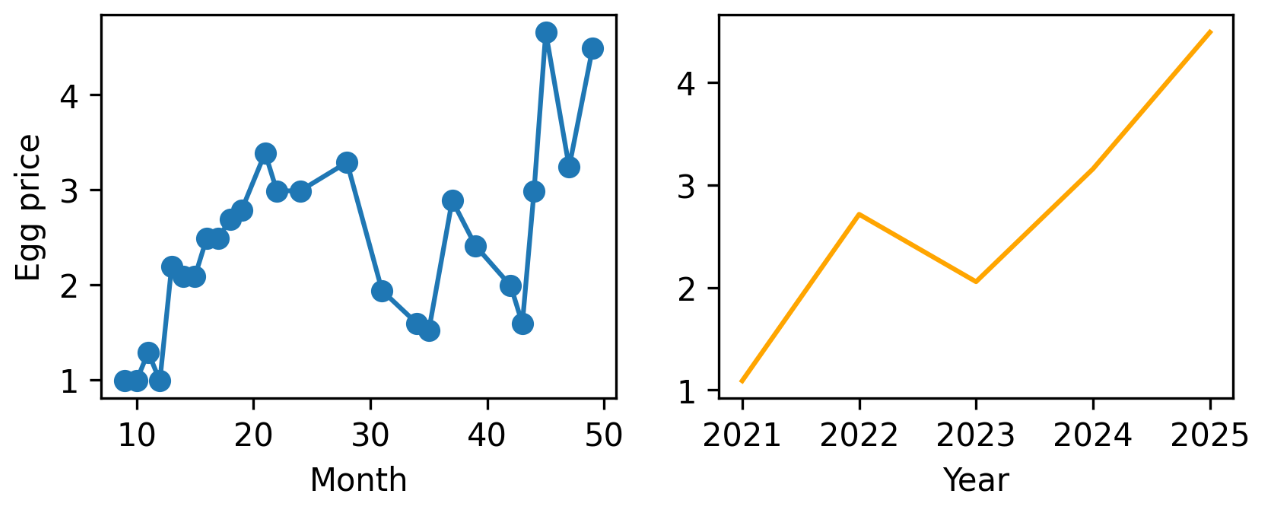
On the graph above we show some of our favorite items for each place. Some may be unexpected: Whole Foods, generally the most expensive market short of gourmet markets, is the place where we can get “natural” peanut - no sugar or oils added, unfortunately it is hard to also avoid salt here in the US - for the best price. It is a special item that we care for just like that, so we suffer Whole Foods every now and then. An interesting finding is also that large chain stores may not have standardized prices even within a single city. A small corner Target store at Beacon Hill, my wife realized, used to sell full 12-egg cartons for $1! Well, that was back in 2022. Regulations on granaries made that go away, but we enjoyed the deal while it lasted! They still sell milk for the best prices.
Other favorite places for us include the traditional Haymarket and Jia Ho market - the latter in China Town - for surplus fruits and veggies, as well as the hispanic market Tropical Foods in Roxbury, for flours and meat (particularly chicken) and some other specialty items.
Dear friend that doubted me, this one is for you! You know who you are! ;-)
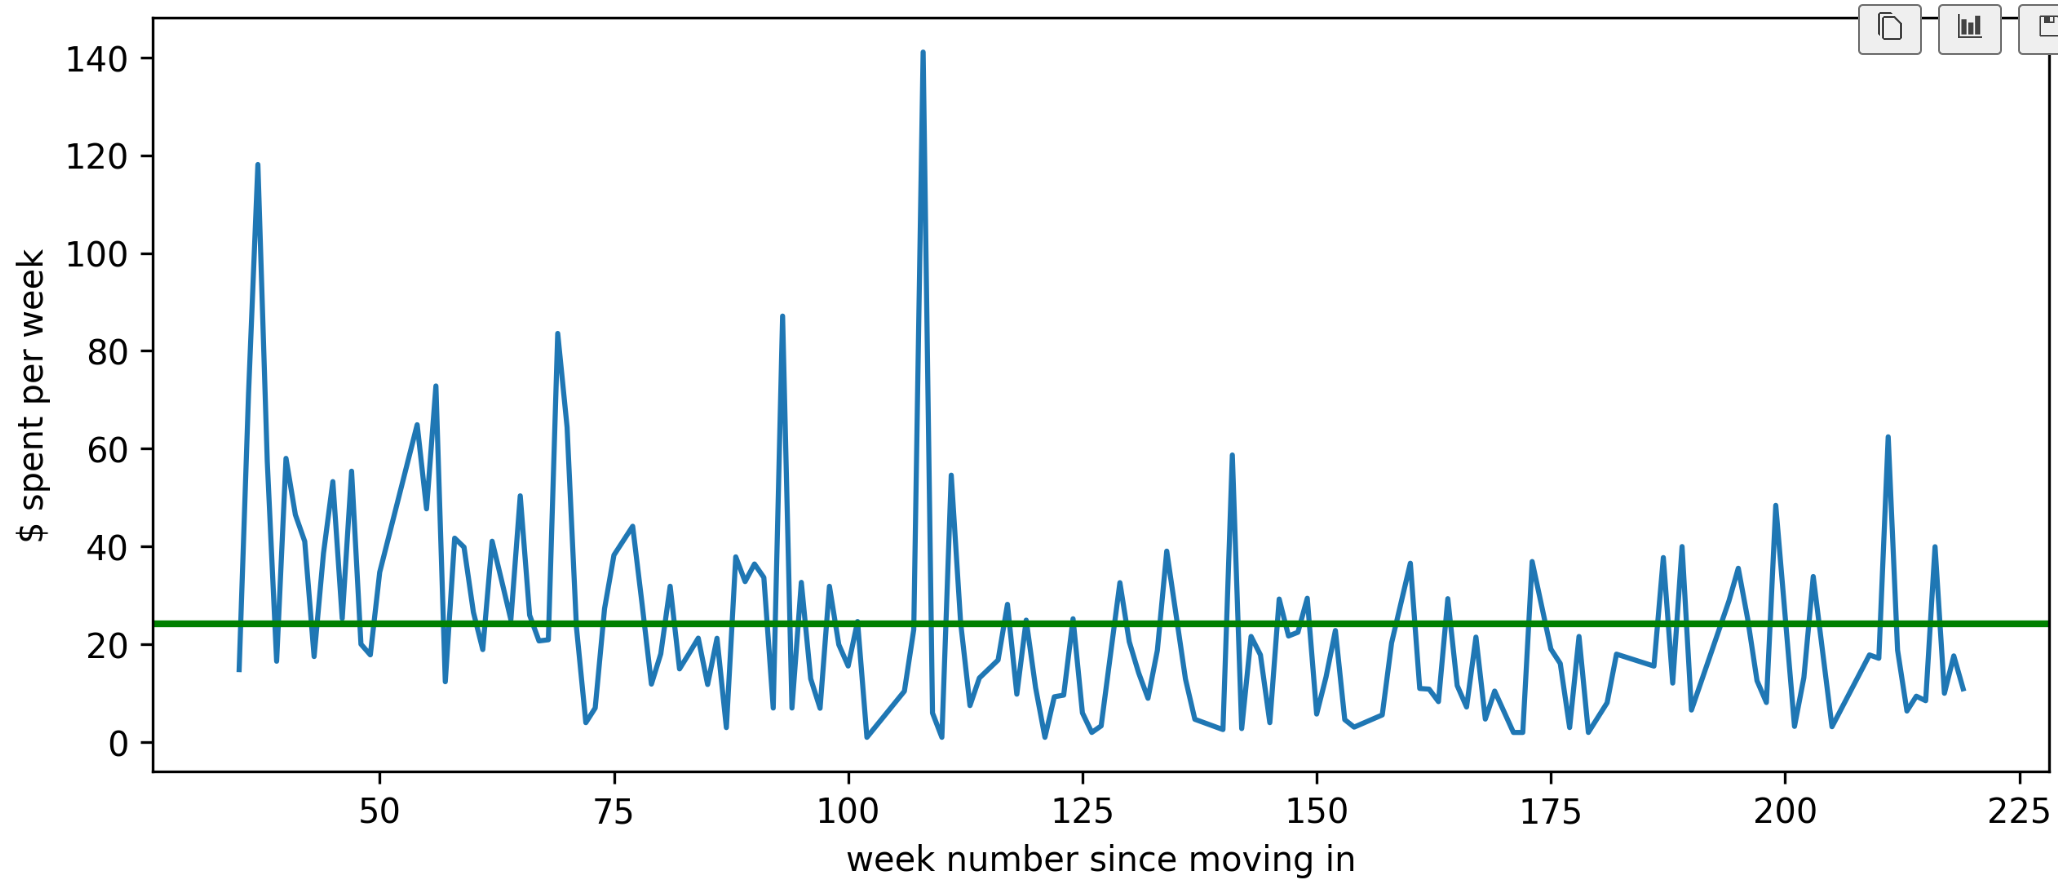
Knowing the right places for the right items, eating mostly home prepped food, and putting the energy to pursue the right deals, we have hit our mark! Averaging through our whole time in Boston, we have spent, on average, close to $25 per week! In fact, averaging our weekly expenses per year, we found that we considerably lowered our expenses as time passed (and despite significant inflation). In recent years (data not shown), we are spending around $19/week on groceries. (for the purists that may not be satisfied with the $25 above, given my original claim while in Vancouver)
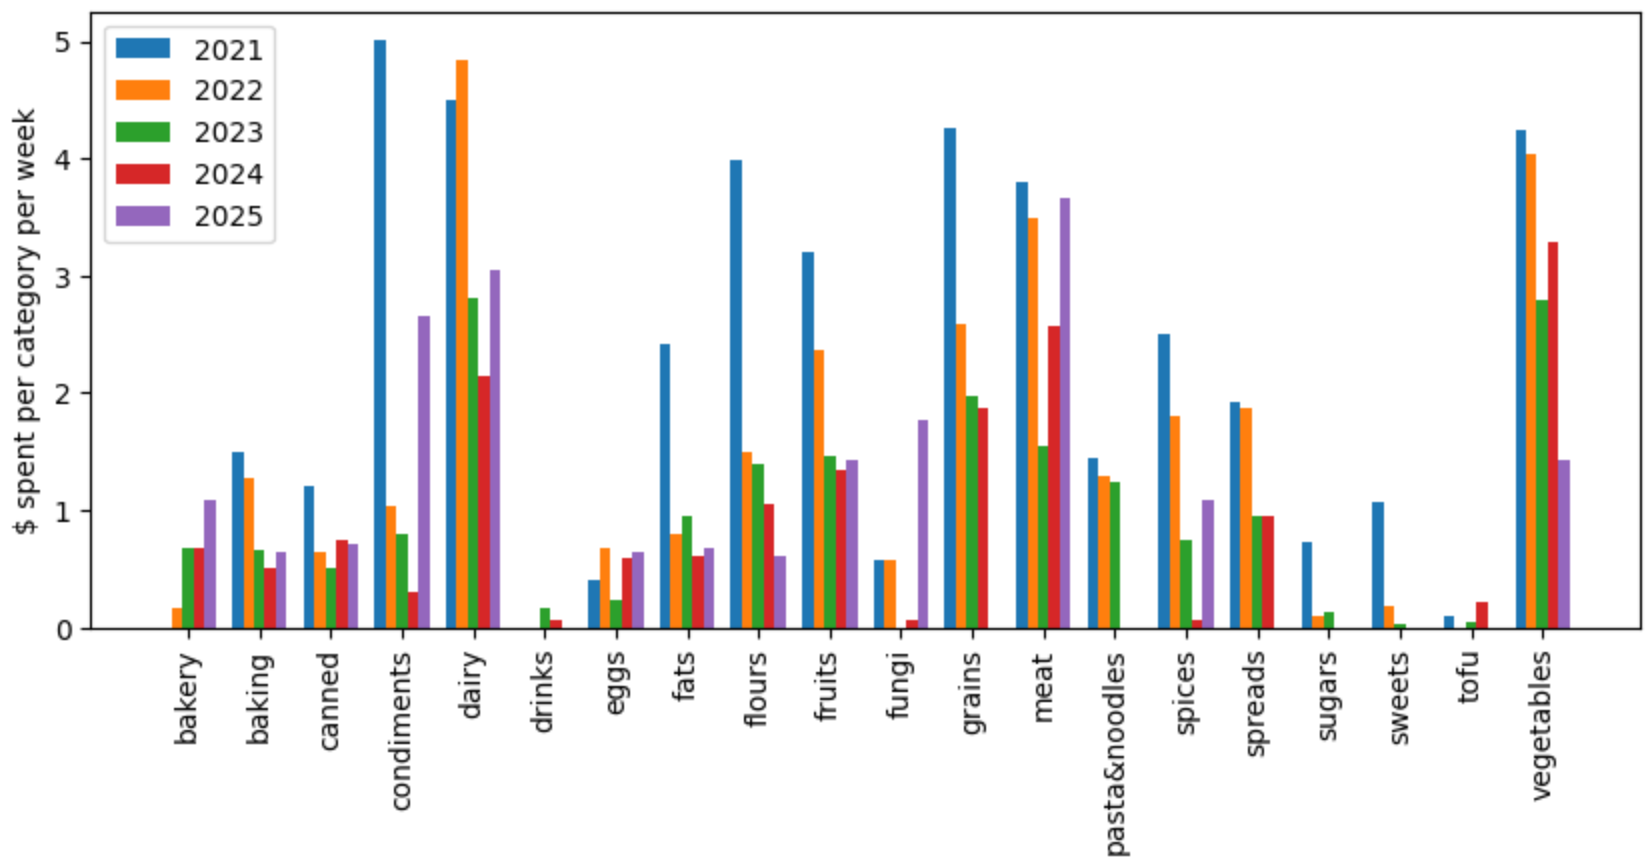
The data suggests all kinds of other interesting patterns, including some degree of periodicity (which we associate with our consuming rate of more industrialized products like condiments and seasonings). Looking at our categorized expenses, it seems like we do pretty well; grains, dairy, vegetables and fruits make bulk expenses, with meat - which is considerably more expensive - matching values, suggesting we don’t buy much meat (even when we do, we tend to go for items usually ignored/discarded by most, like chicken gizzards and beef/pork bones).
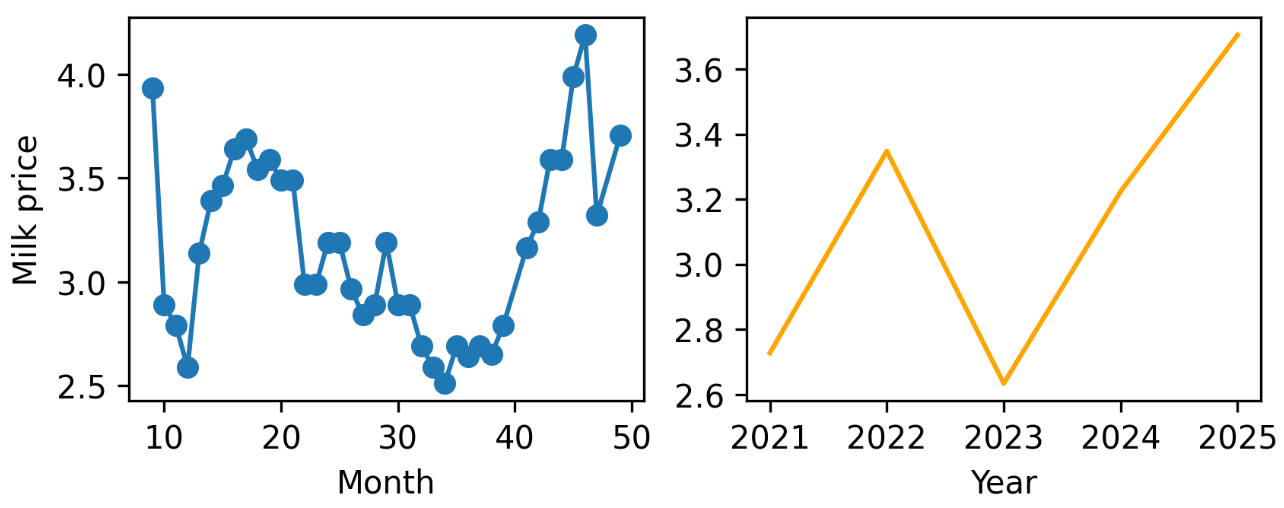
With our data, we can also track how inflation and public policies have affected the prices of different items. A couple favorites are milk and eggs, the former because it is such a staple item for us, and the latter because of having shown a fourfold increase in price through our years of monitoring.
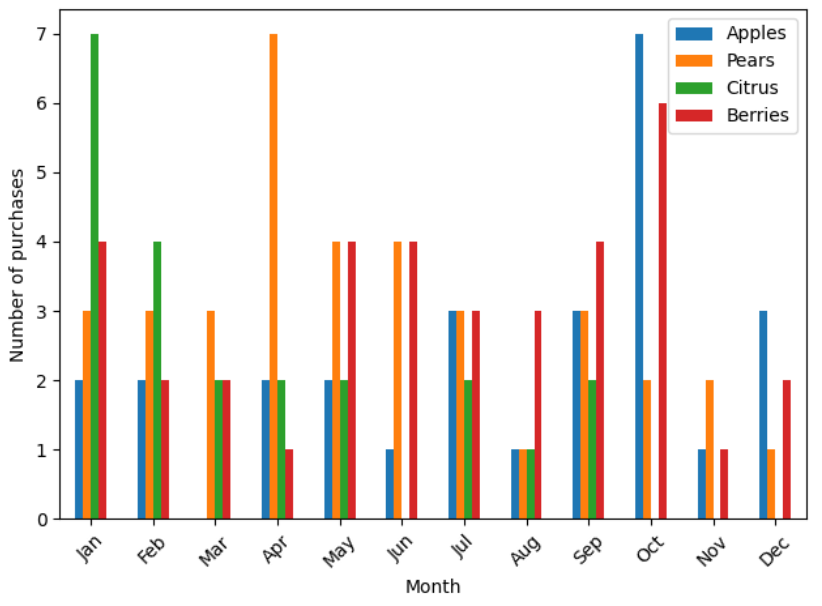
A curious one involves looking at the seasonality of our consumption of fruits. Comparing 4 sub-categories showcases that our purchase pattern (which, take me for my word, follows the best deals we find) is strongly correlated with the seasons for each of these major fruit categories. Surprisingly pears appear to fall out of the line, with peak in our purchases in April. Some explanations for this could include that good deals for pears in that time of the year may involve importing them from the southern hemisphere. Another option would be that, given that pears are generally available throughout the whole year, and late fall in the northern hemisphere is not a good season for any of our major purchase sub-categories, we may default to pears which we like so much!
A commonly shared intuition is that buying foodstuffs in larger quantities result in economy. But is that the case? If so, what is the scaling law?
I don’t hide from anyone my admiration for allometry, so trying to verify a financial - for the lack of opportunity to do biophysical studies - scaling law was a real temptation. Scatter plotting all our purchases with respect to the corresponding quantities bought (normalized to unitless values) gives us direct access to exactly that knowledge!
Indeed, a descending trend is verified on price as function of quantity. A fit showcases that the corresponding scaling law shown for our dataset is $price \sim quantity^{-1.0 \pm 0.1}$!
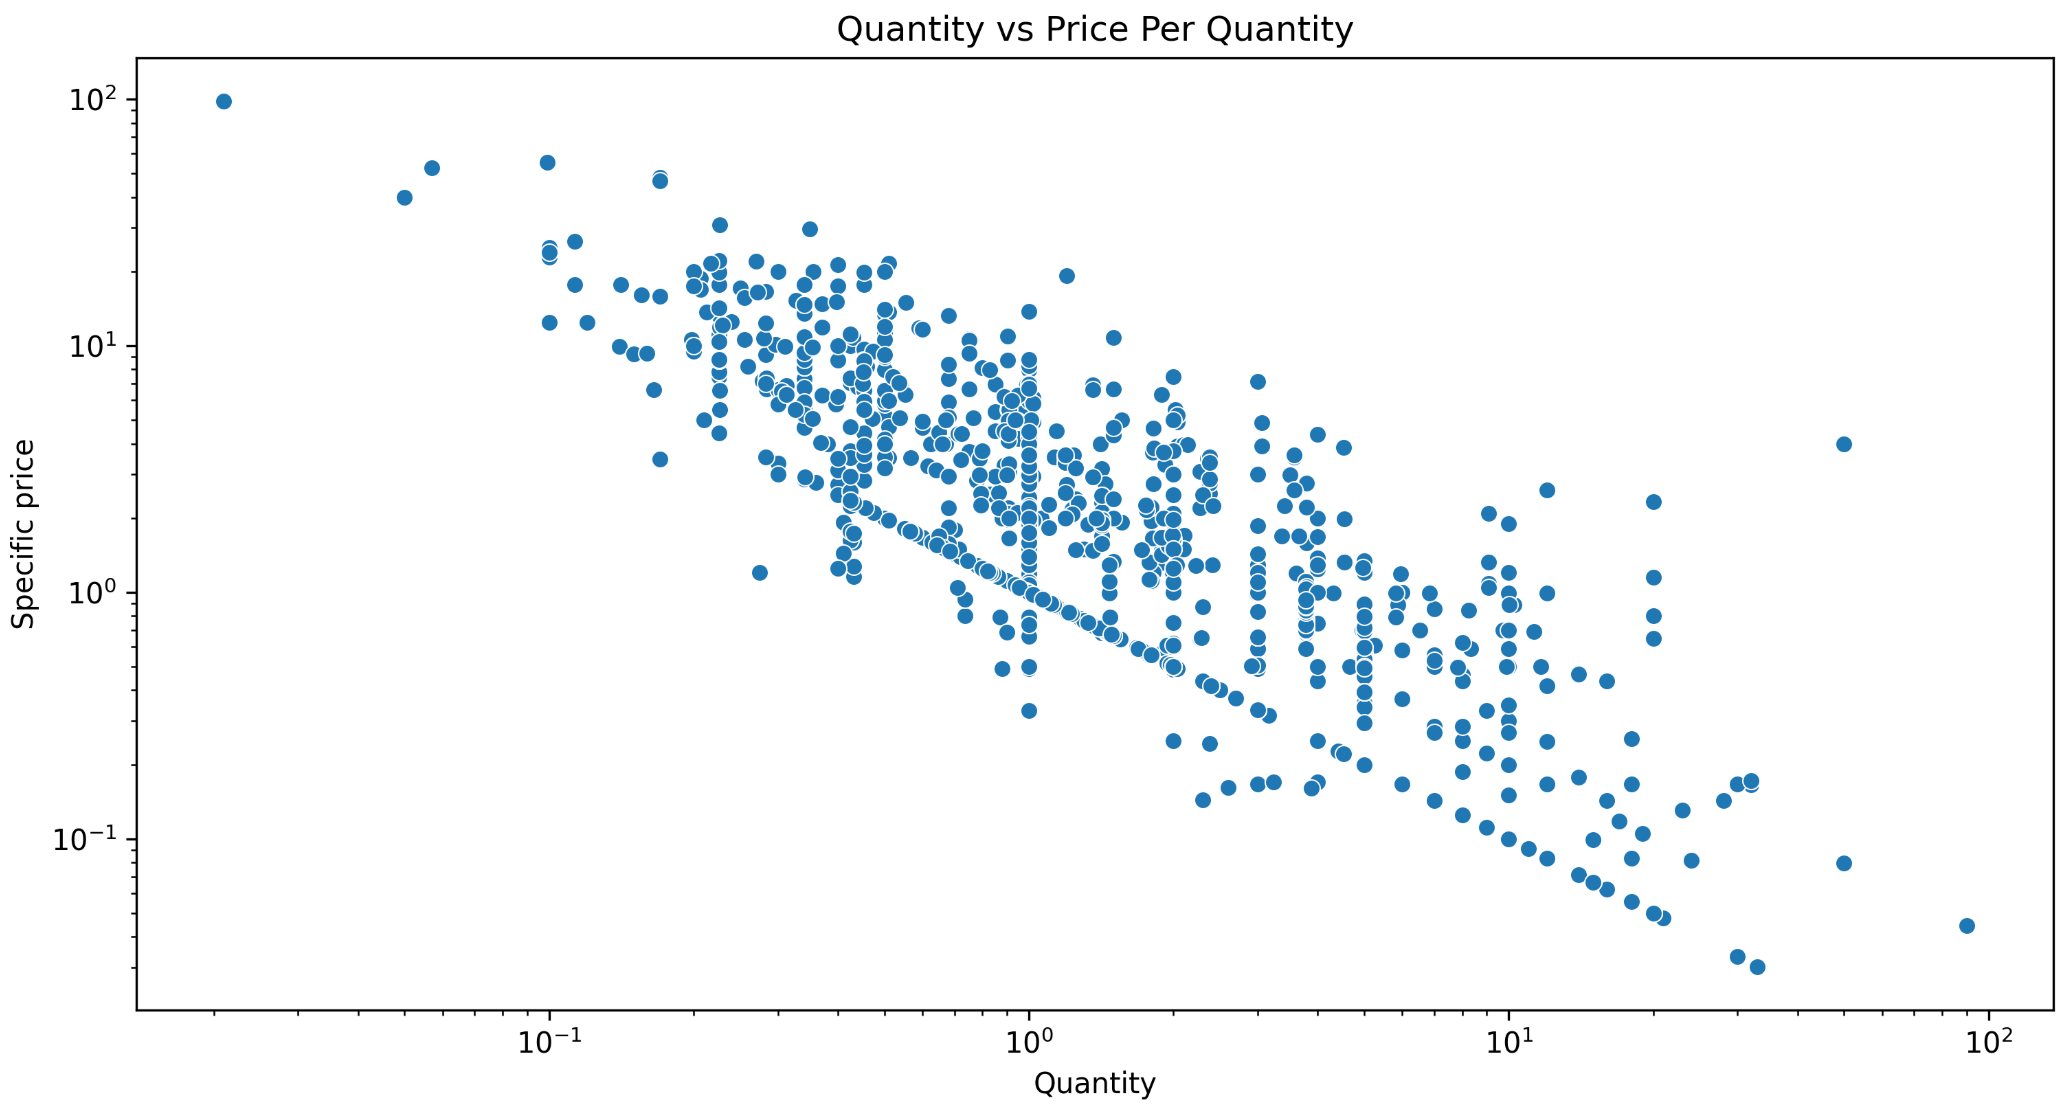
This is an awesome but bittersweet result. Some of us (me!) were really hoping for a non-linear inverse scaling that favored even lower prices for ever larger quantities. We just got inverse proportionality. We did a brief analysis separating quantities measured by volume in separate of weight or units, and the scaling laws do vary; but we lack more data to verify trends with more certainty when we categorize like that. In any case, we find it is awesome to see common knowledge verified and quantified!
Given how expensive central cities are becoming, and given how short student stipends can be, I hope this knowledge can come in handy for many folks, including scientists in the making. The ideas can be replicated in other cities or, if you live in Boston, you may want to deploy them according to your own needs and preferences!
Often I see professional chefs saying that good food depends on quality ingredients. My experience is that cooking is a forgiving science and a multi-sensorial art. If your tomato is not perfectly round, you can still make good pizza sauce, salad, or whatnot. You can make it look good, smell good, and be very appealing. So let it not be said that the use of economy of scale, surplus markets, and undervalued ingredients will limit the quality of what we eat. I will leave you with some photos of what we have cooked, to make our final point, and some words of excitement!


Book Review – Improving How Universities Teach Science (Carl Wieman)
Back to book reviews! The backlog is growing!
This post is a long one in the making. I should dedicate it to my wife, as this has been a family project running for years. We will divert from science mana...
Short post inspired by a big lesson. Recently I was in a conference and me and other scientists were discussing how easy or hard it was to get strong perform...
What better way to start the new year than with Words of Wisdom? For the second installment of our blog series featuring interviews with science managers, we...
Through fall season, Harvard hosts a Science & Cooking course, where science topics relevant for cooking such as soft matter, organic chemistry, heat tra...
Basic project management often begins with a charter—a set of agreements that define the rules and expectations for team collaboration. I believe a team char...
Lazy blogging. I don’t want to reblog a topic someone else just did. So I will just point people to this interesting piece on should students teach? at Conde...
In my journey to expand my knowledge from physics to effective management practices, I maintain a steady, yet unhurried reading pace. I find the experience e...
Recently I have written posts on the challenges and subtleties of keeping a healthy funding stream for a scientific team. We have also covered some creative ...
As a research manager, securing stable funding for your group is a critical responsibility. Your team, whether students or professionals, relies on you as th...
Starting a new blog series at Set Physics to Stun! While most of my posts are based on my own experience, observations, or creations in science and scientifi...
A (total!) eclipse, travel, and hackathons have slowed down my blogging. That together with, for the first time, being asked to do the technical review of a ...
A busy week of teaching and preparing for an upcoming trip to Quebec to witness the eclipse left little time for blogging. Nonetheless, I’ve been mulling ove...
This post tells a bit of my own professional story as I left life as a pure researcher, and then moves toward introducing my first managerial tool for scient...
As I keep trying to create technical content, columns on Nature continue to interrupt me. Seems like these really are good sources of inspiration.
While I was working on a much more technical first post, Nature released a News article on a core raison-d’être of this blog: the trust of public in scientis...
This is it, I can’t believe I am finally starting this! Welcome to “Set Physics to Stun”, my blog on physics, scientific management, and other topics relevan...